# HIDDEN
# Clear previously defined variables
%reset -f

# Set directory for data loading to work properly
import os
os.chdir(os.path.expanduser('~/notebooks/01'))
# HIDDEN
import warnings
# Ignore numpy dtype warnings. These warnings are caused by an interaction
# between numpy and Cython and can be safely ignored.
# Reference: https://stackoverflow.com/a/40846742
warnings.filterwarnings("ignore", message="numpy.dtype size changed")
warnings.filterwarnings("ignore", message="numpy.ufunc size changed")

import numpy as np
import matplotlib.pyplot as plt
import pandas as pd
import seaborn as sns
%matplotlib inline
import ipywidgets as widgets
from ipywidgets import interact, interactive, fixed, interact_manual
import nbinteract as nbi

sns.set()
sns.set_context('talk')
np.set_printoptions(threshold=20, precision=2, suppress=True)
pd.options.display.max_rows = 7
pd.options.display.max_columns = 8
pd.set_option('precision', 2)
# This option stops scientific notation for pandas
# pd.set_option('display.float_format', '{:.2f}'.format)
# HIDDEN
students = pd.read_csv('roster.csv')
students['Name'] = students['Name'].str.lower()
Exploratory Data Analysis
The term Exploratory Data Analysis (EDA for short) refers to the process of discovering traits about our data that inform future analysis.
Here's the students table from the previous page:
students
We are left with a number of questions. How many students are in this roster? What does the Role column mean? We conduct EDA in order to understand our data more thoroughly.
Oftentimes, we explore the data by repeatedly posing questions as we uncover more information.
How many students are in our dataset?
print("There are", len(students), "students on the roster.")
A natural follow-up question: does this dataset contain the complete list of students? In this case, this table contains all students in one semester's offering of Data 100.
What is the meaning of the Role field?
We often example the field's data in order to understand the field itself.
students['Role'].value_counts().to_frame()
We can see here that our data contain not only students enrolled in the class at the time but also the students on the waitlist. The Role column tells us whether each student is enrolled.
What about the names? How can we summarize this field?
In Data 100 we will work with many different kinds of data, including numerical, categorical, and text data. Each type of data has its own set of tools and techniques.
A quick way to start understanding the names is to examine the lengths of the names.
sns.distplot(students['Name'].str.len(),
             rug=True,
             bins=np.arange(12),
             axlabel="Number of Characters")
plt.xlim(0, 12)
plt.xticks(np.arange(12))
plt.ylabel('Proportion per character');
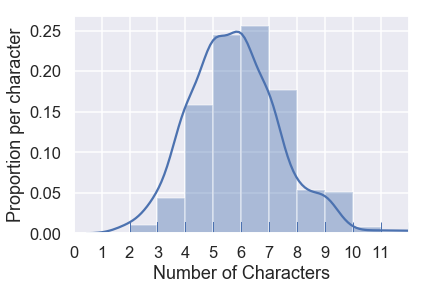
This visualization shows us that most names are between 3 and 9 characters long. This gives us a chance to check whether our data seem reasonable — if there were many names that were 1 character long we'd have good reason to re-examine our data.
What's in a Name?
Although this dataset is rather simple, we will soon see that first names alone can reveal quite a bit about our group of students.